Do you want to discover more? Choose your section here !
| Home 🏡 |
|---|
| From creation to reaction 🎨 ➡️ 💡 |
| Uncovering the patterns of the power players of youtube 🔍 📊 🎥 |
| Uncovering shared commenting patterns 👁️🗨️ 📈 |
| Peering Into the Bubbles 🫧👀 |
| Conclusion |
From creation to reaction 🎨 ➡️ 💡
Understanding YouTube’s content dynamics
The magical art of content creation 🪄
On YouTube, a lot of videos are produced, meaning that a lot of content is created by various channels.
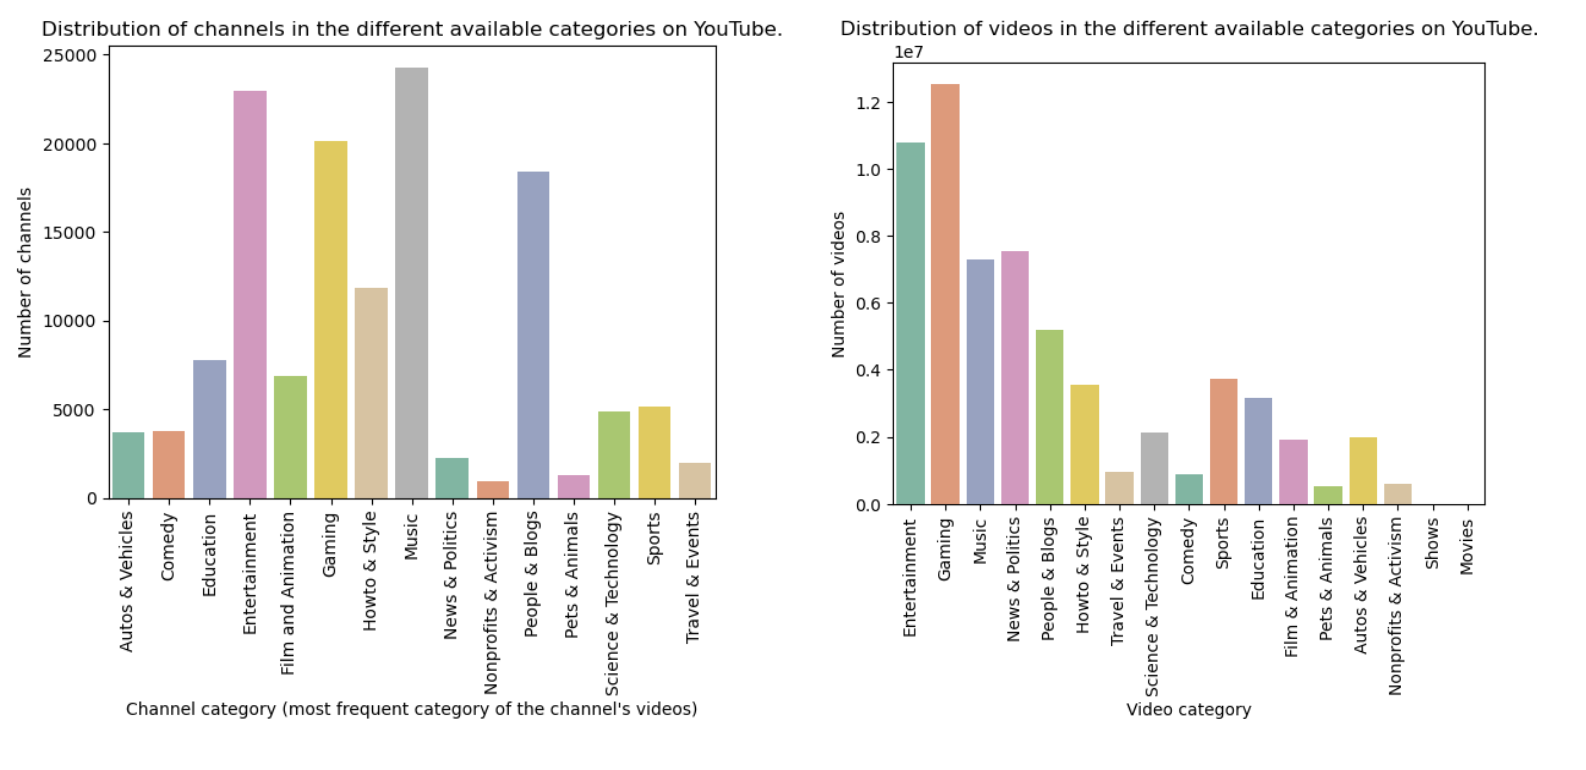
As we can observe on these plots, there are indeed fewer channels of N&P than the other categories. However N&P is one of the categories with the most videos. This suggests that News & Politics YouTubers are relatively active in posting content!
This distribution analysis aligns with our qualitative reasoning mentioned in the introduction, the N&P category is an environment conducive to studying potential users-clusters. With fewer channels producing in total a larger volume of videos , it is more likely for the users to overlap in their interactions, such as commenting on similar videos. Therefore, studying News & Politics videos seems to be a worthwhile pursuit, with a large enough number of videos available, even though it will naturally not fully represent the broader YouTube community.
Even though the N&P category doesn’t have an overwhelming number of channels, there are still around thousands of them ! For this study, we are zooming in on the five leading English speaking news publishers active on YouTube. Curious who made the cut? Let’s check out what the Press Gazette has to say!
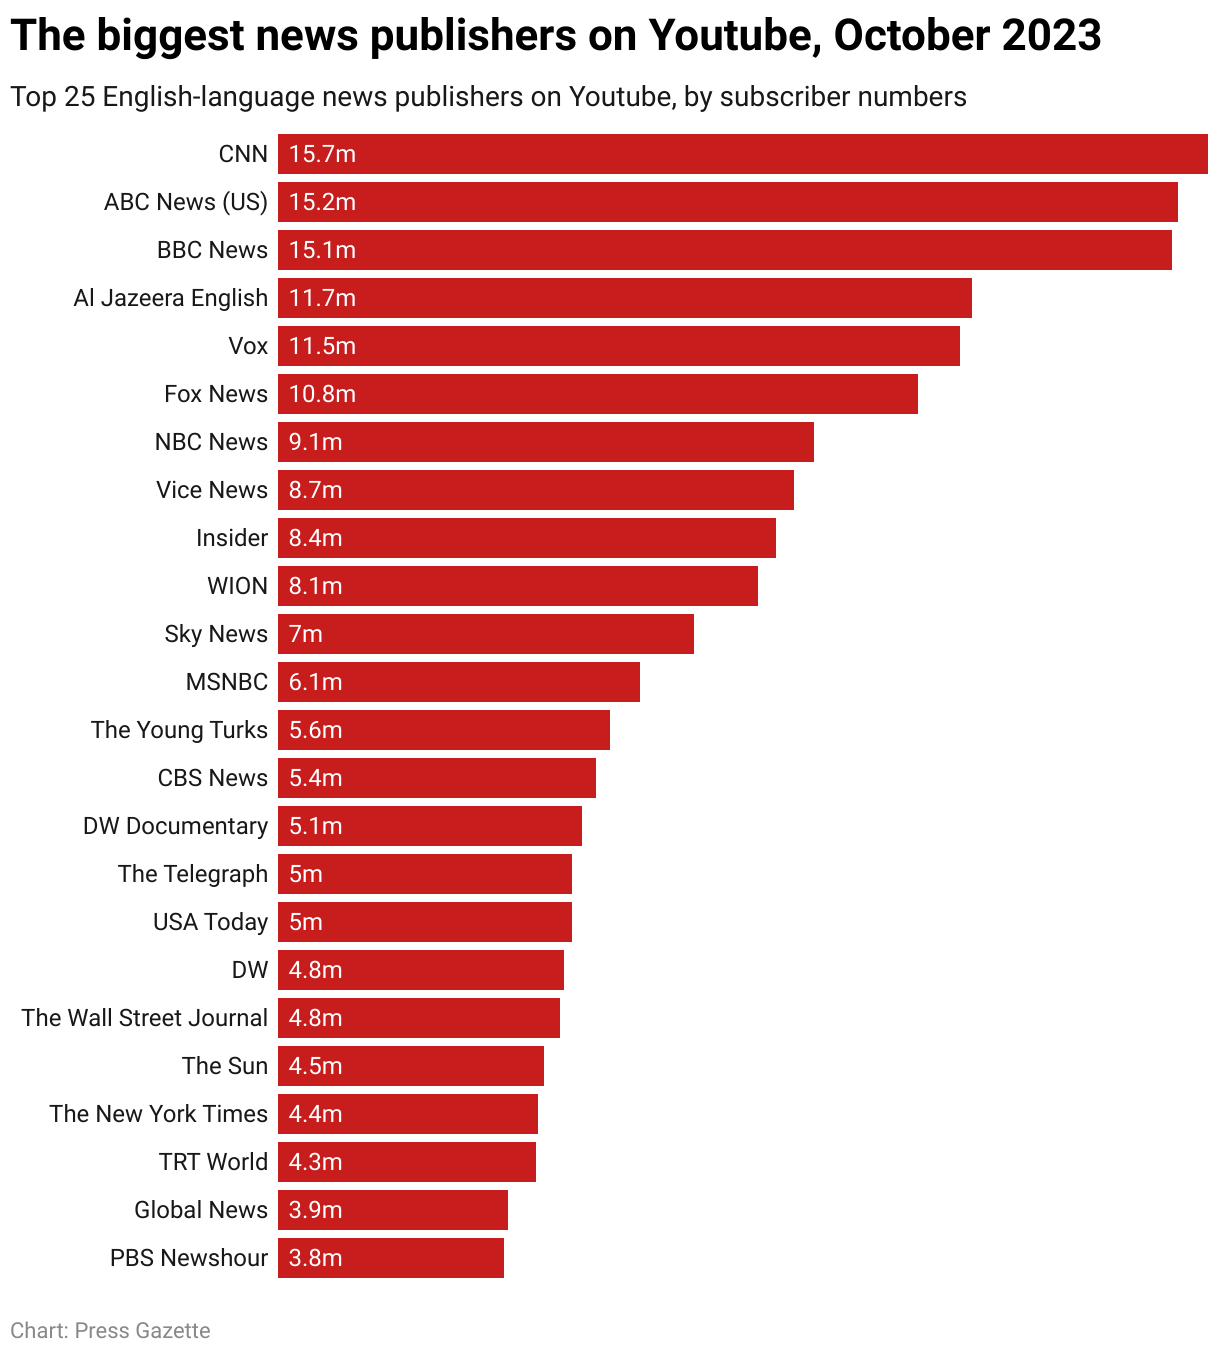
The biggest ones are CNN , ABC News , BBC News, AI Jazeera English and Vox! We checked the dates of the creation of these channels and it turns out that Vox was created in 2013. Since our data spans from 2005 to 2019, it is not relevant for our study. So let’s just take the next one in the ranking, which was created in 2006 : Fox News.
How Content is Received by Viewers: The Spark that Ignites Activity ✨
Once the content is created, it will be watched anywhere from a single to even millions of people! This will generate activity in terms of subscribers or commenters.
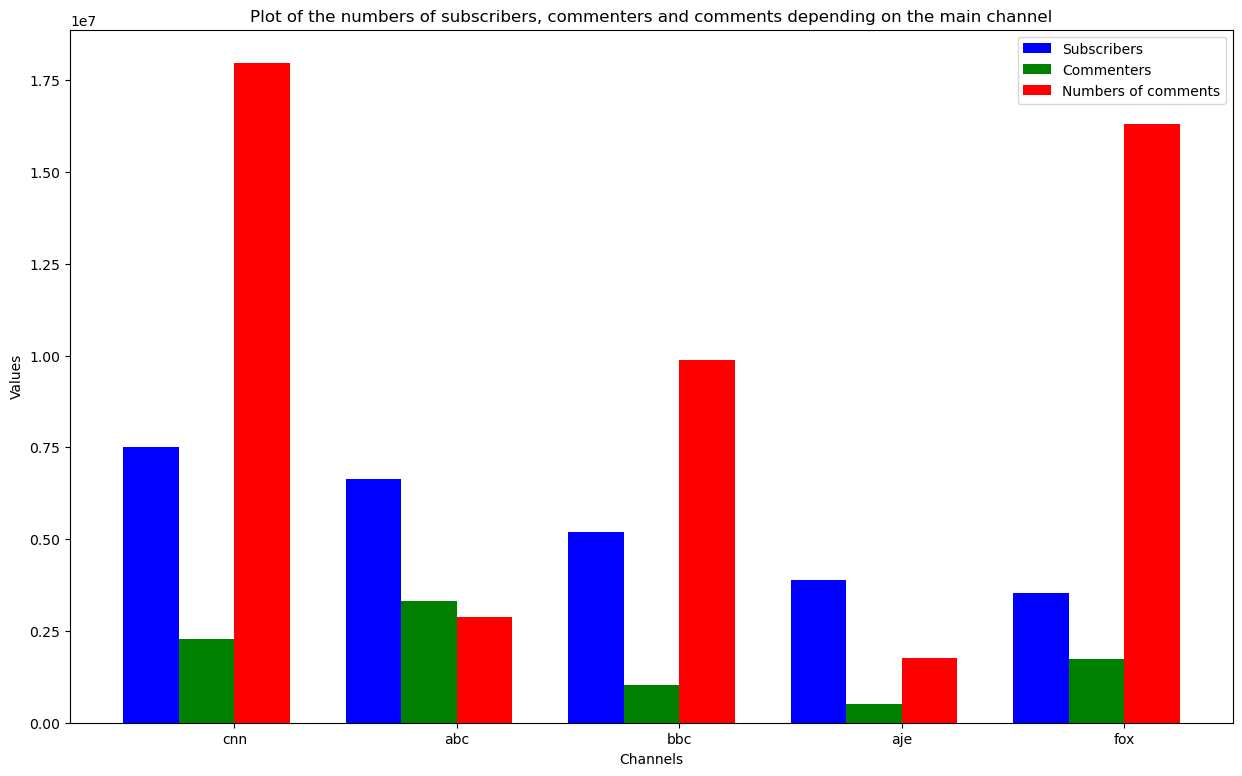
For each channel the number of commenters is significantly lower than the number of subscribers. However a very high number of comments can be seen compared to the number of subscribers and commenters. This is not surprising, as many, likely most commenters will have commented several times under N&P videos.
Let’s confirm this by looking at the distribution of authors per number of comments for each channel.
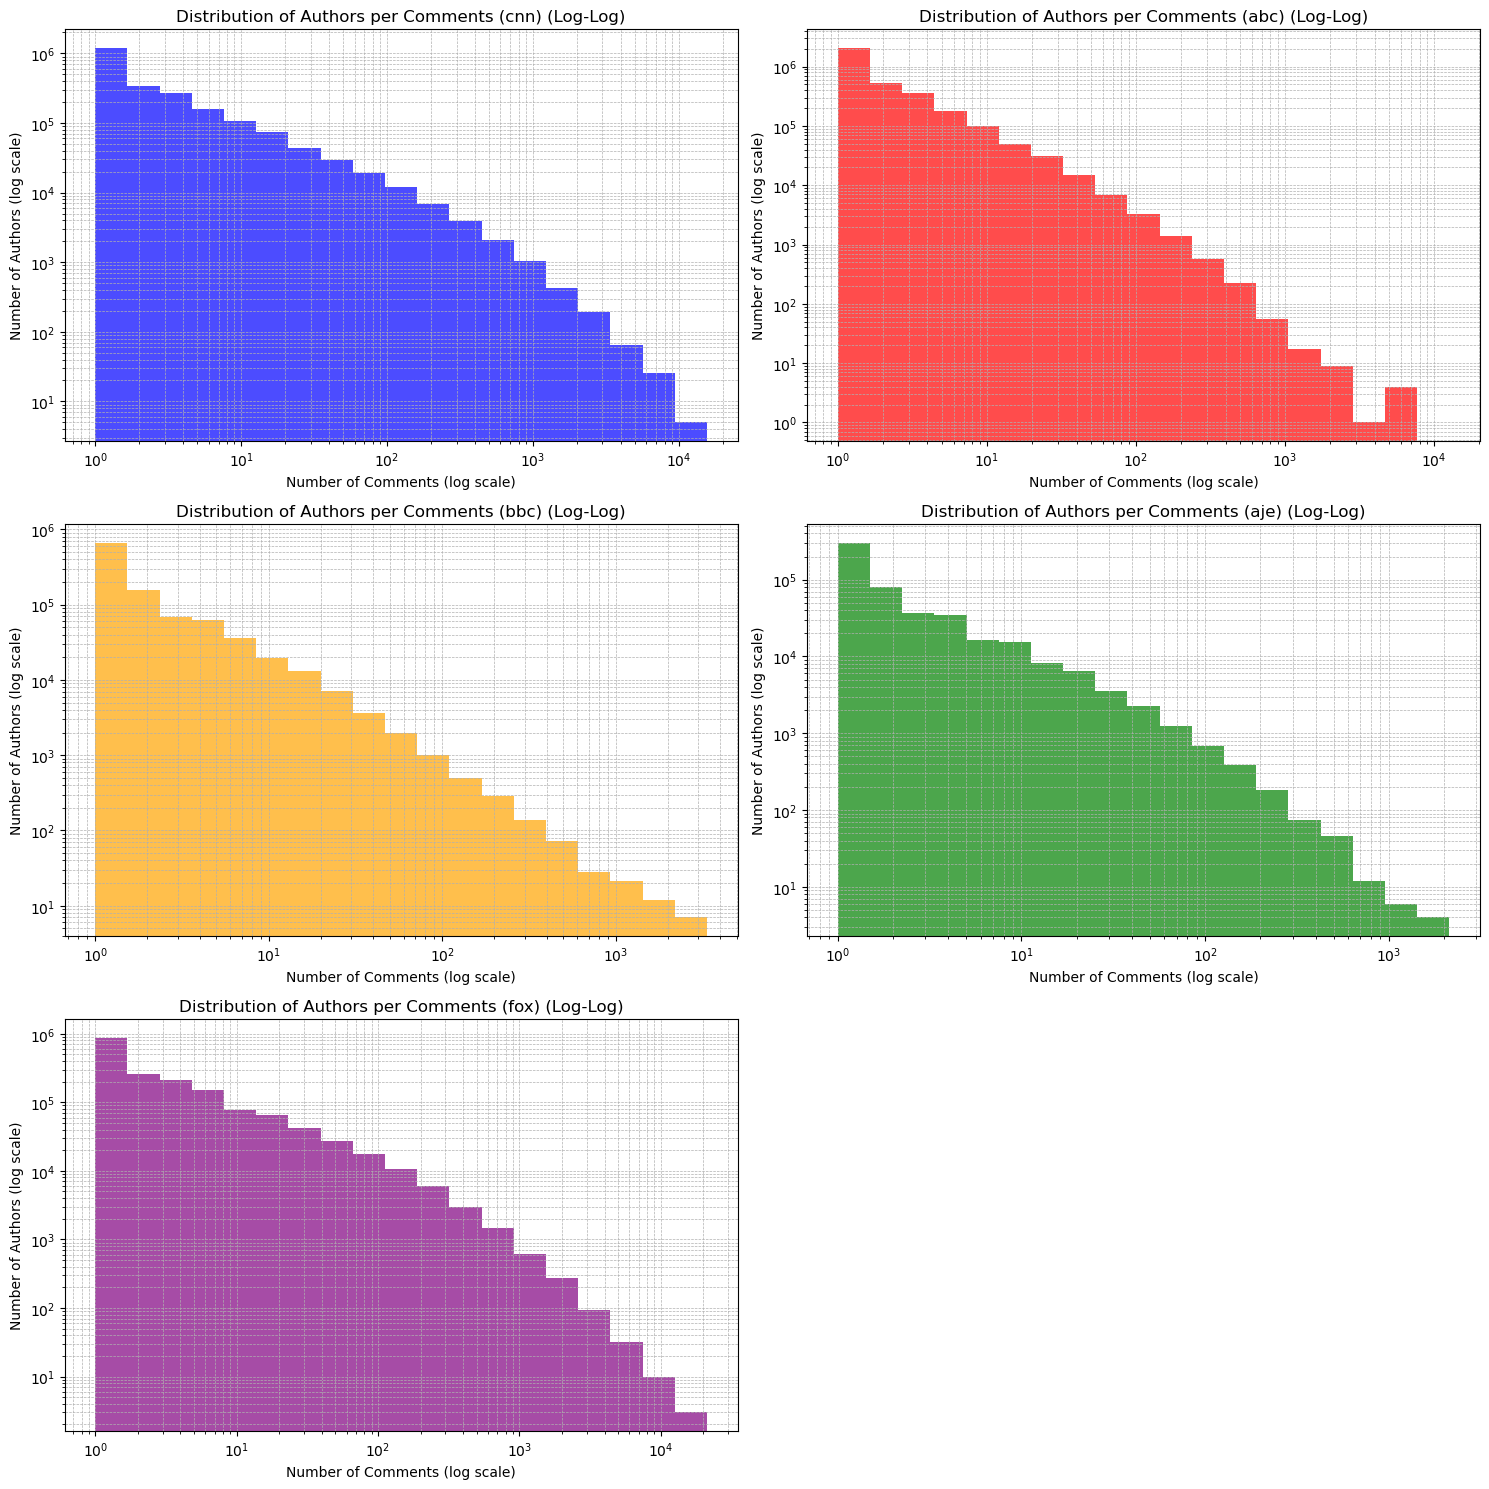
The distribution seems to follow a power law-why? Because the log log plots are (more or less) close to a straight line.
Now looking at the channels, ABC takes the crown for having the most users that barely comment, while AJE has the lowest of such commenters. But what really jumps out is the consistent presence of a “long tail”,across all channels. What does that mean? It’s classic power law behavior , most users post just a handful of comments, while a small number of highly active users contribute significantly more. These highly active users are perfect candidates for forming distinct clusters based on their activity levels.
Now turning our attention to Fox, we notice an interesting pattern. Users tend to be way more active than others, showcasing the presence of differences in user activity levels across the channels. Despite these differences, the general trends remain consistent across all distributions. Based on these observations, let’s dive deeper to uncover the characteristics of the most active users. Are these super-users even different or just louder ?